Having used many technical analysis platforms over my career as a technical analyst, I can tell you with a clear conscience that the ChartList feature on StockCharts provides exceptional capabilities to help you identify investment opportunities and manage risk in your portfolio.
Once you get your portfolio or watch list set up using the ChartList feature, you can use these five powerful tools to break down the list of stocks or ETFs, identify patterns of strength and weakness, and anticipate where the next opportunities may arise!
Summary View to Identify Outliers
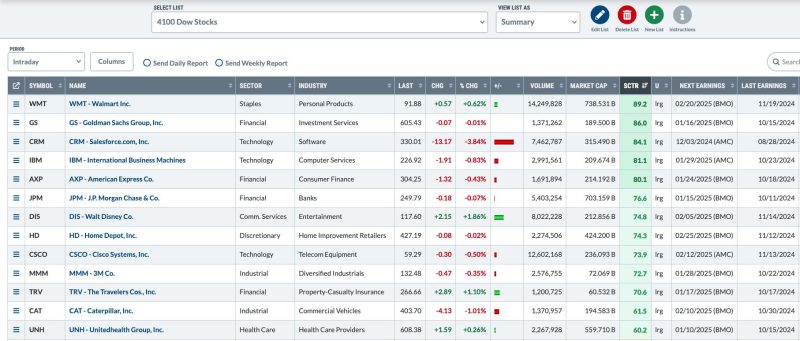
The Summary view is a great starting point, sort of like a high level menu of what all we can do with this list of charts. All of the columns are sortable, so we can begin to find patterns and relationships by grouping similar stocks by sector or sorting by market cap.
One of my favorite things to do right off the bat is sort by “Next Earnings Date”. Whether you’re a long-term investor or a swing trader or somewhere in between, you always want to know when earnings could create a sudden move in either direction!
ChartList View to Analyze Technical Patterns
Once I’ve made some general assessments about the stocks on my list using the Summary View, I like to use the ChartList view to review each chart, one by one. This view uses the alphabetical order of the titles of your charts, so make sure to add numbers before the tickers if you prefer a particular order.
Especially when I’m reviewing a longer list of tickers, I’ll use the ChartList view to go through a bunch of charts, jotting down tickers on my notepad for further review later in the day. It’s easy to switch all of the charts to a different ChartStyle, which comes in handy if you want to switch to weekly or monthly charts, for example. Just select one of the charts, change the ChartStyle, then look for a link called “Apply ChartStyle to All” at the bottom!
CandleGlance View to Separate Into Buckets
When I worked at a large financial institution in Boston, I would print out a bunch of charts representing a particular fund’s holdings, then spread the charts out on a conference table. I’d look for similar patterns and structures, and start to separate the charts into bullish, bearish, and neutral piles. From there, I could focus my attention on the most actionable charts.
The CandleGlance view provides this capability without having to print out all of those charts! We can easily detect similar patterns and signals, helping me spend my time on the most actionable charts within a larger list. I can’t tell you how much time this one feature has saved me in terms of efficiently breaking down a list of charts! Don’t forget that you can customize the ChartStyle you use for this view, allowing you to apply your own proprietary charting approach to this visualization.
Performance View to Focus on Consistent Winners
What if you just want to analyze the performance of a group of stocks or ETFs, to better understand which charts have been the most and least profitable over a period of time? The Performance View shows a series of time frames in tabular format, allowing you to focus on top and bottom periods over multiple time frames.
This can be a fantastic way to break down your portfolio, helping you better understand which positions have been helping your performance, and which ones may actually have been holding you back!
Correlation View to Understand Price Relationships
Finally, we come to one of the most underutilized features of ChartLists, and that’s the Correlation View. This can help better define the relationship between two different data series, and identify which stocks or ETFs could help us diversify our portfolio.
I like to sort this view in ascending order based on the 20-day correlation as a starting point. Which stocks demonstrated a very different return profile from the S&P 500? When it feels as if all stocks are doing about the same thing, this one feature can help you quickly identify outliers and positions which could help you improve your performance through diversification.
I’ve found the ChartList capabilities to be some of the most powerful features on the StockCharts platform. Once you get into the habit of using these incredible list management and analytical tools, I hope you’ll enjoy a greater amount of market awareness in your life!
RR#6,
Dave
PS- Ready to upgrade your investment process? Check out my free behavioral investing course!
David Keller, CMT
President and Chief Strategist
Sierra Alpha Research LLC
Disclaimer: This blog is for educational purposes only and should not be construed as financial advice. The ideas and strategies should never be used without first assessing your own personal and financial situation, or without consulting a financial professional.
The author does not have a position in mentioned securities at the time of publication. Any opinions expressed herein are solely those of the author and do not in any way represent the views or opinions of any other person or entity.


