HAPPY NEW YEAR!!!
Ever since the introduction of RRG back in 2011, many people have asked me questions like: “What is the track record for RRG” or “What are the trading rules for RRG”?
My answers have always been, and will continue to be, “There is no track record for RRG, as there is not one set of rules.”
Relative Rotation Graphs are primarily a data visualization tool that can be applied to many different markets, on many different time frames and with varying degrees of risk. Most of the time, I countered these questions with “What is the track record of a bar chart?” or “What are the trading rules for a bar chart?” That said, it is possible to come up with some “rules” or “conditions” that can be tested and repeated — in particular, two prerequisites for a quantitative and rules-based approach.
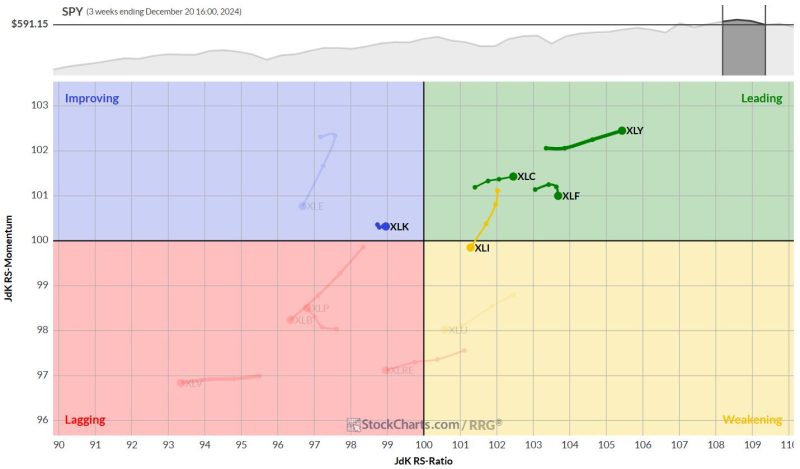
On and off over the last few years, I have been “playing around” with a few different approaches to get to something that can run objectively. This is still very much a work in progress project, but my plan for 2025 is to share the outcomes of version 1 of this approach, using the 11 SPDR sector ETFs, in this blog on a weekly basis and track the results.
I am not planning to disclose all the ins and outs of the methodology at this point in time, as this may lead to an investable product at some stage. But the basis lies in combining various weekly and daily RRG data points into one metric and create a ranking for the 11 sectors which allows me to determine the “best five sectors.”
Going forward I will publish this list on a weekly basis and track the performance of a portfolio that consists of the best 5 sectors each at a 20% weight.
In the first week of 2025 this is the portfolio we start with:
XLY
XLC
XLF
XLK
XLI
Weekly RRG
Daily RRG
Price Charts
Consumer Discretionary
Consumer Discretionary is holding up well after the upward break. The area around 210 should act as support in case of a decline.
Relative strength continues strongly.
Communication Services
Communication Services is testing the former rising resistance line as support, while relative strength broke out of its trading range and seems to be moving higher.
Financials
The rhythm of higher highs and higher lows on the price chart remains intact. Relative strength is now testing the upper boundary of the former trading range as support.
Technology
Technology continues to struggle with overhead resistance around the 240 area, but there is no significant drop in prices as seen in other sectors. Relative strength remains within the boundaries of its trading range.
Industrials
Industrials is testing the rising support line; as long as this holds, things are still okay. Looking at relative strength, it is clear why this is the fifth sector. A small double top has completed, and some relative weakness seems to be lying ahead.
#StayAlert and have a great weekend, –Julius


