


All of our major indices continue to rally off the April 7th, cyclical bear market low. A couple, however, have broken out of key bullish continuation patterns that measure to all-time highs. I’ll focus on one in today’s article.
Russell 2000
The IWM is an ETF that tracks the small-cap Russell 2000 and it’s chart couldn’t be much more bullish right now. After setting an all-time high on November 25, 2024 at 243.71, the IWM fell into its own cyclical bear market, dropping to a low of 171.73 on April 7th. That represented a drop of 71.98 points, or 29.54%, well beyond the 20% cyclical bear market threshold. A bottoming reverse head & shoulders pattern formed and I’ve been awaiting for a breakout above neckline resistance at 211. We saw that on today’s open after nonfarm payrolls highlighted our somewhat resilient economy as jobs came in ahead of expectations and the unemployment rate held steady. Check out this chart on the IWM:
I’m not saying that we’ll see a straight up move to 249, and short-term direction could be impacted by how we finish today. A weak afternoon could lead to further short-term selling, possibly back to the rising 20-day EMA. But, ultimately, and during 2025, I’m looking for that all-time high. A strong finish this afternoon and close on or near the daily high would add more bullishness to this chart.
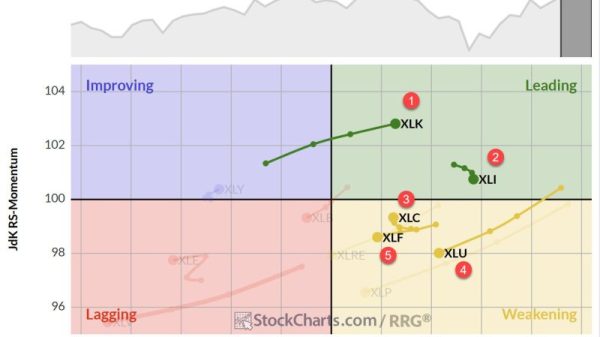
Leading Stocks in Leading Industry Groups
The small cap IWM is no different than any of our other major indices, like the S&P 500 and NASDAQ 100. When you see an index breakout, you need to look to the leading stocks in that area in order to outperform the benchmark index. We started our Leading Stocks ChartList (LSCL) two weeks ago and the results have been absolutely phenomenal so far, which I would expect them to be. After last week, we produced our 2nd weekly LSCL and the results have been awesome once again. There were 43 stocks included and 32 of the 43 have outperformed the S&P 500 this week. That’s similar results to our first weekly LSCL.
Individual stock leaders from our LSCL included the following big winners as of 1pm ET today:
PRCH: +16.89%
DOMO: +15.75%
LASR: +15.40%
HOOD: +15.10%
QBTS: +13.17%
TTMI: +11.62%
ZS: +10.76%
These are exceptional returns when you consider the benchmark S&P 500 gained just 1.38% this week.
I want to provide all of our followers a SPECIAL OFFER to join our FREE EB Digest newsletter. Subscribe HERE with only your name and email address (no credit card required), and we’ll provide you a link and password to download this unique Leading Stocks ChartList (LSCL) and check it out for yourself. You need to be an Extra or Pro member at StockCharts in order to download the ChartList into your account. Basic members and non-members can view the ChartList and check out the stocks we include for next week.
Happy trading!
Tom